
Diabetes Transformation Score™: Why HbA1c Isn’t the Whole Story
Your last HbA1c came back at 6.4%. Your doctor glanced at it, said “good, keep it up,” and moved to the next patient.
So why do you still feel tired by 4 PM? Why is your waistline still growing even though your “number” looks fine? Why does one week feel like real progress and the next feel like you’re right back where you started — with no way to tell which one is actually true?
HbA1c is one of the most useful numbers in diabetes care. It is also, on its own, an incomplete picture. This article explains why — and introduces a simple way to see the parts of your progress that a single blood test was never designed to show.
Executive Summary of Diabetes Transformation Score™
HbA1c measures your average blood sugar over roughly three months, but it cannot show day-to-day glucose swings, sleep quality, stress load, medication burden, or organ-level trends — all of which shape how you actually feel and how your diabetes will progress.
The Diabetes Transformation Score™ is an educational, multi-domain tracking framework from Diabetes Intelligence™ that looks at 12 areas of metabolic health alongside your lab work, so you and your doctor can see real trends between HbA1c tests — not just a single number every three months. It is a complement to your physician’s care, not a replacement for it.
Key Takeaways of Diabetes Transformation Score™
- HbA1c is a 3-month average — it can look “normal” while hiding large daily glucose swings, poor sleep, high stress, or early organ strain.
- Two people can share the exact same HbA1c and be on completely different health trajectories.
- The Diabetes Transformation Score™ tracks 12 domains beyond blood sugar alone — weight, waist, blood pressure, lipids, sleep, energy, stress, activity, glucose variability, medication burden, organ protection, and quality of life.
- This is an educational framework, not a diagnostic test, and it is designed to be used alongside your doctor’s labs and advice — never instead of them.
- You can see where you actually stand across all 12 domains with a free, doctor-designed self-assessment.
Why HbA1c Alone Isn’t Enough
HbA1c (glycated hemoglobin) estimates your average blood glucose over the previous two to three months by measuring how much sugar has attached itself to hemoglobin in your red blood cells. It’s a genuinely useful number — it’s why doctors worldwide use it as a cornerstone of diabetes monitoring, and nothing in this article should be read as a reason to skip or de-prioritize it.
But an average has a well-known blind spot: it can’t distinguish between someone whose glucose stays gently steady all day and someone whose glucose swings wildly between spikes and crashes but happens to land on the same average. This is precisely why the diabetes research community itself has spent the last decade building “beyond A1C” metrics — Time in Range, Time Below Range, glycemic variability — into major clinical journals. The idea that A1C alone is insufficient isn’t a marketing claim; it’s an active, mainstream area of clinical research.
There’s a second blind spot: HbA1c only reflects blood sugar. It says nothing about your sleep debt, your cortisol-driven stress load, whether your blood pressure or lipids are quietly drifting, how many medications you’re now taking to hold that number steady, or whether early strain is building in your kidneys, eyes, nerves, or heart. Two patients can walk into a clinic with the identical HbA1c and be living very different realities.
Two Patients, Same HbA1c — Different Reality
| Patient A | Patient B | |
| HbA1c | 6.4% | 6.4% |
| Daily glucose pattern | Frequent spikes and crashes that average out | Steady, gentle curve all day |
| Sleep | 4–5 hours, fragmented | 7 hours, consistent |
| Stress load | High, unmanaged | Moderate, with active coping habits |
| Medication count | Increasing over the last year | Stable or reducing under doctor supervision |
| Energy levels | Low, fatigued most afternoons | Stable through the day |
| Organ-risk trend | Early strain markers emerging | Stable or improving |
Same test result. Two very different trajectories — and a single lab value, taken once every three months, will not tell you which patient you are. That gap is exactly what a multi-domain tracking approach is built to close.
See also: CGM Precision Intelligence™ for how continuous glucose data reveals the daily pattern behind the average.
What Is the Diabetes Transformation Score™
The Diabetes Transformation Score™ is an educational self-tracking framework built by Diabetes Intelligence™, designed to give you and your doctor a fuller view of metabolic progress than a single lab number can provide.
It is important to be precise about what this is and isn’t:
- It is an educational tool that organizes 12 areas of your health into one trackable view over time.
- It is designed to be reviewed alongside your prescribed lab tests and your physician’s guidance.
- It is not a diagnostic test, a substitute for HbA1c or any other blood test, and it is not endorsed by any clinical guideline body (ADA, WHO, IDF, or otherwise).
- It does not determine medication changes — only your treating doctor can do that.
The underlying idea is simple: diabetes doesn’t just live in a blood sample — it shows up in how well you sleep, how your body handles stress, how consistent your activity is, and how your organs are holding up over time. Tracking only one of those threads and ignoring the rest means you’re managing the disease with one eye closed. The Transformation Score™ opens the other eye.
The Science Behind Multi-Domain Progress Tracking
The case for looking beyond a single marker isn’t new — it’s how modern chronic disease management has been trending for years. Cardiology moved past “just check cholesterol” toward composite risk scores that weigh blood pressure, lipids, weight, and lifestyle together. Diabetes care is following the same path: continuous glucose monitoring research now routinely reports Time in Range and glycemic variability alongside HbA1c, precisely because clinicians recognized that averages can hide clinically important patterns. Emerging research on metabolic flexibility — how well your body switches between burning sugar and fat for fuel — is asking a similar question from a different angle: is glucose control the whole story, or just one chapter of it?
Multi-domain tracking applies that same logic to day-to-day self-monitoring. Instead of waiting three months for one number, you build a rolling picture across the areas that actually predict how diabetes will unfold for you — sleep, stress, movement, weight distribution, medication trend, and organ-level markers — reviewed together instead of in isolation.
Evidence-Based vs. Clinical Insight Evidence-based: HbA1c reflects average glucose but not variability; CGM-derived metrics like Time in Range are recognized in the clinical literature as meaningful additions to A1C; sleep, stress, and physical activity are each independently linked to glycemic control in peer-reviewed research.
Clinical insight (Diabetes Intelligence™’s practical framework): Organizing these factors into one 12-domain score to make trends easier for patients to track and discuss with their doctor. This organizing framework itself is a Diabetes Intelligence™ educational tool and has not been independently validated in clinical trials.
The 12 Domains of Diabetes Transformation Score™
Each domain below answers a question your HbA1c report never asks. Together, they form the Transformation Score™.
- Weight Body weight trends are one of the strongest predictors of insulin resistance and treatment response — but a single weigh-in tells you nothing about direction. What matters is the trend line, not the day’s number.
- Waist Circumference Two people at the same body weight can carry very different amounts of visceral (abdominal) fat, which is more metabolically active — and more closely tied to insulin resistance — than fat elsewhere on the body. Waist tracking catches what a bathroom scale misses.
- Blood Pressure High blood sugar and high blood pressure frequently travel together and compound each other’s damage to blood vessels, kidneys, and eyes. A domain focused purely on glucose can miss a quietly rising blood pressure trend.
- Lipid Profile Cholesterol and triglyceride patterns shift alongside insulin resistance, often before glucose numbers move at all. Tracking lipids as their own domain catches early metabolic drift.
- Sleep Quality Poor or fragmented sleep raises cortisol and reduces insulin sensitivity the very next day — a well-documented, direct physiological link, not a lifestyle platitude. Sleep debt can quietly undo weeks of dietary effort.
- Energy Levels Persistent afternoon fatigue is often one of the earliest signals of glucose variability or poor sleep recovery — and it’s a symptom patients notice long before any lab test would flag it.
- Stress Load Chronic stress keeps cortisol elevated, which directly signals the liver to release more glucose and blunts insulin’s effectiveness. Stress isn’t a “soft” factor here — it has a measurable glucose effect.
- Physical Activity Consistency matters more than intensity. Regular movement improves how efficiently muscles take up glucose, independent of weight change — which is why activity is tracked as its own domain rather than folded into “lifestyle.”
- CGM / Glucose Variability For those using a glucose monitor, this domain captures the pattern behind the average — spikes, crashes, and Time in Range — the exact blind spot HbA1c has by design. (Deepened further in the CGM Precision Intelligence™ pillar.)
- Medication Burden This domain tracks the trend in medication complexity over time — whether it’s rising, stable, or being carefully reduced under a doctor’s supervision — never specific drugs or doses. Any change to medication is a decision made exclusively by your treating physician.
- Organ Protection Long-term high blood sugar can quietly affect the eyes, kidneys, nerves, and heart years before symptoms appear. This domain tracks the general risk trend across these areas over time. (Expanded in depth in the DORI™ and 7 Organ Protection Framework™ pillars.)
- Quality of Life Ultimately, the point of every other domain is this one — how you actually feel, function, and live day to day. A “controlled” lab number that comes with constant fatigue and food anxiety isn’t the full definition of success.
12 Domains at a Glance of Diabetes Transformation Score™
| Domain | What It Tracks | Why HbA1c Misses It |
| Weight | Trend over time | A1C reflects glucose, not body composition |
| Waist Circumference | Visceral fat pattern | Two same-weight people can differ hugely here |
| Blood Pressure | Cardiovascular strain | Runs on a completely separate physiological track |
| Lipid Profile | Cholesterol/triglyceride trend | Shifts before glucose numbers do |
| Sleep Quality | Duration & consistency | A1C can’t see last night at all |
| Energy Levels | Daily functional capacity | Purely subjective — no lab captures it |
| Stress Load | Cortisol-driven glucose impact | Invisible in a 3-month average |
| Physical Activity | Consistency of movement | Not reflected in a single blood draw |
| CGM / Glucose Variability | Daily spikes and crashes | This is A1C’s core, defining blind spot |
| Medication Burden | Trend in treatment complexity | A1C can look identical on more or fewer medicines |
| Organ Protection | Long-term risk trend | Organ strain predates lab abnormalities |
| Quality of Life | How you actually feel | The outcome every other domain exists to serve |
The Diabetes Transformation Dashboard™
Once you complete the assessment, your 12 domains are plotted onto a single visual — a radar-style dashboard where each spoke represents one domain, scored from your current inputs. Instead of one number in isolation, you see a shape.
A shape tells you something an average never can. A dashboard pulled in tight and even across all 12 spokes looks different from one that’s strong on six domains but collapsed on three — even if both patients would report the exact same HbA1c that month. The second patient isn’t failing; they simply have specific, visible domains to work on, instead of one vague instruction to “control your sugar better.”
Where relevant, the dashboard shows a before-and-after view — your first assessment plotted alongside your most recent one, so improvement (or a domain quietly slipping) is visible at a glance rather than buried in a stack of old lab reports.
Illustrative Dashboard Read-Out
| Domain | First Assessment | 90 Days Later |
| Weight | Needs attention | Improving |
| Waist Circumference | Needs attention | Improving |
| Blood Pressure | Stable | Stable |
| Lipid Profile | Needs attention | Stable |
| Sleep Quality | Needs attention | Improving |
| Energy Levels | Low | Improving |
| Stress Load | High | Moderate |
| Physical Activity | Low | Improving |
| Glucose Variability | High | Improving |
| Medication Burden | Rising | Stable |
| Organ Protection | Needs attention | Stable |
| Quality of Life | Low | Improving |
(Illustrative example only — individual results vary and depend on starting condition, adherence, and medical guidance.)
The Monthly Scorecard
A single dashboard is a snapshot. A Monthly Scorecard turns it into a story — because the question that actually predicts your long-term outcome isn’t “what’s my score today,” it’s “which direction is it moving, and how consistently.”
Each month, your 12 domains are re-scored and compared against the previous month, with a simple trend indicator: improving, stable, or needs attention. Over three to six scorecards, patterns emerge that a single HbA1c test — taken once a quarter — is structurally unable to show: a stress domain that spikes every time work travel picks up, a sleep domain that predicts next month’s energy domain almost perfectly, a medication-burden trend that’s been quietly stabilizing for months before the lab confirms it.
This is the entire point of multi-domain tracking: direction and consistency, reviewed monthly, tell you more about where you’re headed than a single number reviewed quarterly.
How This Fits Your Existing Care — Clinical Intelligence Framework Integration
None of this replaces your physician. It’s worth repeating plainly: the Diabetes Transformation Score™ is a between-visit tracking layer, not a parallel treatment system.
Here is exactly where it sits:
- Your doctor orders and interprets your labs (HbA1c, lipid panel, kidney function, and any others relevant to you) — that clinical picture remains the foundation.
- The Transformation Score™ fills the gap between those lab visits, so you and your doctor aren’t flying blind for the 10–12 weeks between HbA1c tests.
- Any change to medication, insulin, or treatment plan is made exclusively by your treating doctor, based on their clinical judgment and your labs — never by a dashboard.
- If your Transformation Score™ shows a domain trending in the wrong direction, the right next step is a conversation with your doctor, armed with specific data, not a self-directed change.
Think of it as bringing a detailed diary to a doctor who used to only get to ask, “how have things been?” It doesn’t change what the doctor does with that information — it changes how much useful information they have to work with.
Relationship to the Rest of the Diabetes Intelligence™ Ecosystem
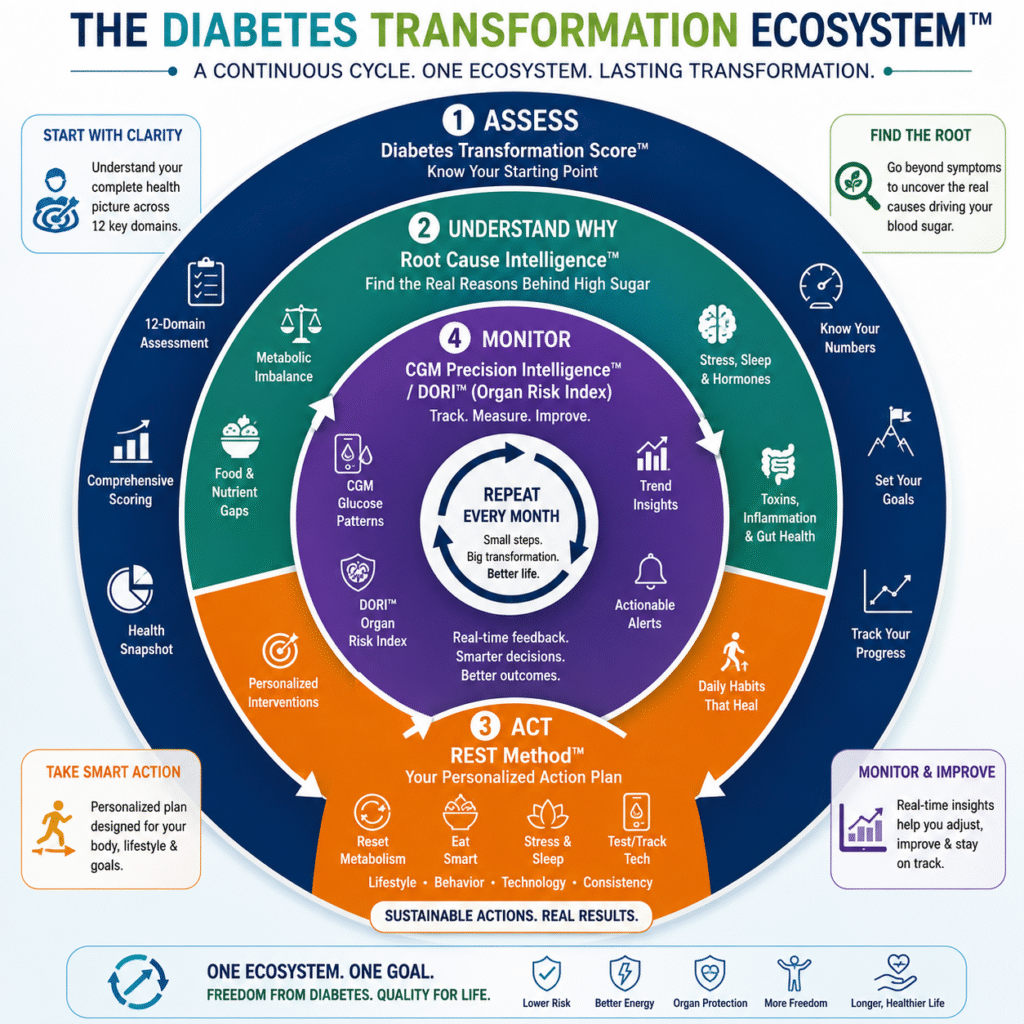
The Transformation Score™ doesn’t work alone — it’s the assessment layer of a larger educational system, and each of its domains connects to a deeper framework designed to help you actually move the number:
- REST Method™ is the action layer — the day-to-day practices (built around Science, Behaviour, Food, and structured routine) that are designed to move your domains in the right direction once you know where you stand.
- Root Cause Intelligence™ is what explains why a particular domain is stuck — for example, why your stress domain isn’t improving despite effort, by looking one level deeper than the symptom.
- DORI™ (Diabetes Organ Risk Index™) deepens Domain 11 (Organ Protection), giving a more detailed view of long-term organ-level trend.
- CGM Precision Intelligence™ deepens Domain 9 (Glucose Variability) for anyone using a continuous glucose monitor, turning raw glucose data into a readable pattern.
- 7 Organ Protection Framework™ expands Domain 11 further into a structured, organ-by-organ protective checklist.
Put together, the ecosystem follows a simple logic: Assess (Transformation Score™) → Understand Why (Root Cause Intelligence™) → Act (REST Method™) → Monitor (CGM Precision Intelligence™ / DORI™) — a loop, not a one-time test.
Illustrative Case Studies
The following are illustrative composites built to demonstrate how the framework applies in practice. They are not real patients, and no individual outcome is guaranteed — results vary based on starting condition, adherence, and medical supervision.
Case A — “The Normal-Looking Report” A 44-year-old working professional with an HbA1c of 6.3% was reassured by his lab report but privately frustrated by constant afternoon fatigue and a waistline that kept growing despite “eating clean.” His first Transformation Score™ dashboard showed the story his A1C couldn’t: high stress load, poor sleep consistency, and low physical activity — three domains quietly working against him while his glucose average happened to stay in range. Addressing sleep and stress first, rather than tightening his diet further, was the shift that mattered.
Case B — “The Number That Looked Worse Than It Was” A 52-year-old homemaker with an HbA1c of 7.8% felt discouraged, assuming she was “failing.” Her dashboard told a different story: 8 of her 12 domains were trending in the right direction — sleep, stress, activity, and energy had all improved over three months — even though her A1C hadn’t caught up yet. The scorecard gave her (and her doctor) visible evidence of real momentum that a single lab number, taken in isolation, would have missed entirely.
Doctor Interpretation Guide
This section is written to be printed or shared directly with a treating physician.
What this dashboard is: A patient-completed, 12-domain self-tracking summary intended to supplement — not replace — standard laboratory monitoring (HbA1c, lipid panel, renal function, and other tests as clinically indicated).
How to read it: Each domain reflects patient-reported or device-derived data (where a glucometer/CGM is in use) at the time of assessment, with month-over-month trend direction. It is not derived from laboratory analysis and should be interpreted as self-reported lifestyle and symptom tracking.
What it is useful for: Identifying which lifestyle domains (sleep, stress, activity, medication-trend perception) may be contributing to a patient’s glycemic pattern between visits, and prioritizing counseling accordingly.
What it is not: A diagnostic instrument, a validated clinical risk score, or a basis for medication titration on its own. Any treatment decision should continue to rely on standard clinical assessment and laboratory data.
Suggested use in consultation: Ask the patient to bring their most recent 2–3 monthly scorecards. A domain trending consistently in the wrong direction over multiple months — independent of the HbA1c trend — may warrant targeted discussion (e.g., a sleep or stress domain that hasn’t moved despite glucose stability).
How to Take Your Free Diabetes Transformation Score™
Getting your first dashboard takes about five minutes:
- Answer the assessment — a short set of questions covering all 12 domains (weight, waist, blood pressure, lipids, sleep, energy, stress, activity, glucose pattern, medication trend, organ-risk indicators, and quality of life). No blood draw required to get started.
- Get your instant dashboard — see your 12-domain radar view the moment you finish, showing exactly where you’re strong and where to focus first.
- Download your doctor one-pager — a printable summary you can bring to your next appointment, so the conversation starts from data instead of guesswork.
- Retake monthly — a single dashboard is a snapshot; retaking it monthly is what turns it into a Scorecard that shows real direction.
Take Your Free Diabetes Transformation Score™
Common Myths vs Facts
| Myth | Fact |
| “If my HbA1c is normal, I don’t need to track anything else.” | A normal HbA1c can still hide poor sleep, high stress, or early organ strain — the exact gap this framework is built to close. |
| “This score can diagnose diabetes or prediabetes.” | It’s an educational tracking tool, not a diagnostic test. Diagnosis requires standard laboratory testing by a physician. |
| “A good score means I can reduce or stop my medicines myself.” | Medication decisions are made exclusively by your treating doctor, based on clinical judgment and labs — never by a self-assessment. |
| “I need a CGM device to use this.” | Only Domain 9 (Glucose Variability) benefits from CGM data. The other 11 domains work from simple self-reported inputs. |
| “One month’s score tells the full story.” | A single dashboard is a snapshot. The trend across several monthly scorecards is what actually predicts your trajectory. |
| “This replaces my HbA1c or other lab tests.” | It’s designed to sit alongside your labs, filling the gap between them — never to replace them. |
Summary
HbA1c remains an essential, well-validated tool — but it was never designed to show the whole picture. Sleep debt, stress load, medication trend, and early organ strain can all move in the wrong direction while your average stays exactly where your doctor wants it. The Diabetes Transformation Score™ closes that gap by tracking 12 domains together, turning three months of silence between lab tests into a monthly, visible trend — reviewed alongside your doctor’s care, never instead of it.
Related Articles
- REST Method™ — the day-to-day action framework that moves your domains
- DORI™ (Diabetes Organ Risk Index™) — a deeper look at Domain 11, Organ Protection
- CGM Precision Intelligence™ — turning continuous glucose data into a readable pattern (Domain 9)
Frequently Asked Questions
HbA1c Limitations
Is HbA1c enough to track diabetes progress? It’s a valuable and necessary marker, but on its own it only shows a 3-month average — not daily glucose swings, sleep, stress, or organ-level trends that also shape your progress.
Why can two people have the same HbA1c but different health outcomes? Because an average can be reached in very different ways — steady glucose all day, or sharp spikes and crashes that happen to average out to the same number, with very different long-term effects.
Can HbA1c be normal while blood sugar still swings a lot? Yes. This is one of HbA1c’s best-documented limitations, which is why continuous glucose monitoring metrics like Time in Range have become an important addition in diabetes research.
How often should HbA1c be tested? This is a decision for your doctor based on your individual treatment plan — commonly every 3 months for many patients, but frequency varies by case.
What does HbA1c NOT tell you? It doesn’t show daily glucose variability, sleep quality, stress load, medication trend, or early organ-level strain — all of which the 12-domain framework is designed to surface.
What the Score Is
What is the Diabetes Transformation Score™? An educational, 12-domain self-tracking framework from Diabetes Intelligence™ that gives you a fuller view of metabolic progress than a single lab value alone.
Is this a medical diagnosis tool? No. It’s an educational tracking tool, not a diagnostic test. Diagnosis of diabetes or prediabetes requires standard laboratory testing by a physician.
Is it approved or clinically validated? It is not endorsed by any clinical guideline body (ADA, WHO, IDF, or otherwise) and has not been independently validated in clinical trials. It’s a practical organizing framework, clearly labeled as such.
How is it different from a regular diabetes risk calculator? Most risk calculators predict future risk from a few static inputs. This framework tracks ongoing, monthly trend across 12 lifestyle and health domains you can actually influence.
Who created this framework? It was developed by Dr. D.K. Rai (MBBS, MD, CDM) and the Diabetes Intelligence™ team as part of the broader Diabetes Care Home™ patient education system.
The 12 Domains
Why track waist circumference separately from weight? Two people at the same weight can carry very different amounts of visceral fat, which is more metabolically active and more closely tied to insulin resistance than fat elsewhere on the body.
How does stress actually affect blood sugar numbers? Chronic stress keeps cortisol elevated, which signals the liver to release more glucose and reduces insulin’s effectiveness — a direct, measurable physiological link, not just a lifestyle factor.
Why is sleep part of a diabetes score? Poor or fragmented sleep measurably reduces insulin sensitivity the very next day, which is why sleep debt can quietly undo weeks of dietary effort.
What counts as “medication burden”? The domain tracks the general trend in treatment complexity — rising, stable, or reducing under a doctor’s supervision — never specific drugs, doses, or self-directed changes.
How does organ protection get measured without lab tests? This domain tracks a general risk trend based on self-reported symptoms and history; it is not a substitute for the specific lab tests (kidney function, eye exams, nerve screening) your doctor may order.
What is quality of life scoring based on? Self-reported day-to-day function — energy, mood, food-related anxiety, and general wellbeing — because that’s the outcome every other domain ultimately exists to serve.
Do I need a CGM device to use this? No. Only Domain 9 (Glucose Variability) is deepened by CGM data. The other 11 domains work from simple self-reported inputs.
Can I improve some domains without medicine changes? Yes — sleep, stress, activity, and quality-of-life domains typically improve through lifestyle changes alone, though any change involving medication should always go through your doctor.
Taking the Assessment
How long does the assessment take? About five minutes for the full 12-domain questionnaire.
Is it free? Yes, the assessment itself is free. Guided program options exist for those who want structured, doctor-led support afterward — details are available directly via WhatsApp.
Is my data private? Your responses are used to generate your personal dashboard and are handled according to Diabetes Care Home™’s privacy practices; avoid including any information you’re not comfortable sharing digitally.
Can I take it if I don’t have diabetes yet (prediabetes)? Yes — it’s equally useful for prediabetes, since several domains (stress, sleep, activity, weight trend) are meaningful well before a formal diabetes diagnosis.
Can family members take it too? Yes, each person should complete their own assessment individually for an accurate personal dashboard.
Interpreting Your Dashboard
What’s a “good” Transformation Score? There’s no single universal “good” score — the framework is designed around your own trend over time, not a comparison to a fixed benchmark.
How often should I retake it? Monthly is recommended — frequent enough to catch a trend, infrequent enough to reflect real change rather than daily noise.
What if my score goes down one month? A single month’s dip isn’t a verdict — look at the domain-level detail and discuss any domain that’s trended the wrong way for two or more consecutive months with your doctor.
Can this replace my lab tests? No. It’s designed to sit alongside your HbA1c and other prescribed labs, filling the gap between them — never to replace them.
Framework Relationships
What is REST Method™ and how does it relate to this score? REST Method™ is the day-to-day action framework designed to move your domains in the right direction once your Transformation Score™ shows you where to focus.
What is DORI™? The Diabetes Organ Risk Index™ — a deeper, more detailed look at Domain 11 (Organ Protection) within the broader Transformation Score™.
How does CGM Precision Intelligence™ fit in? It deepens Domain 9 (Glucose Variability) for anyone using a continuous glucose monitor, turning raw glucose data into a readable daily pattern.
What is the 7 Organ Protection Framework™? An organ-by-organ educational checklist that expands further on Domain 11, covering the eyes, kidneys, nerves, heart, and other commonly affected systems.
Doctor & Clinical Use
Can I show this to my own doctor? Yes — the printable doctor one-pager is designed specifically to be brought to a consultation and reviewed alongside your labs.
Will my doctor accept this as valid tracking? Most physicians are receptive to structured, self-reported lifestyle data when it’s clearly labeled as educational tracking rather than presented as a diagnostic result — which is exactly how this framework is positioned.
Does this replace regular checkups? No. Regular checkups and lab tests remain essential regardless of your Transformation Score™ trend.
Can this be used alongside insulin or other medication? Yes — the framework is designed to be used by patients on any treatment plan; it simply tracks trend and never advises on medication itself.
Practical / Cost / Access
How much does the full program cost? The self-assessment is free. Structured program pricing varies by tier — current details are best confirmed directly via WhatsApp, since offers may change.
Is this only for people in India? The educational content applies broadly, though the guided program and lifestyle recommendations are tailored with Indian diet, routines, and healthcare context in mind.
Do I need to visit in person? No — the assessment and guided program are designed to run remotely, primarily over WhatsApp.
Is there a free trial? The 12-domain self-assessment itself is free and unlimited to retake monthly.
Safety
Can I stop my medicines based on my score? No. Medication decisions are made exclusively by your treating doctor. Never stop, reduce, or change medication based on a self-assessment result.
What if my score shows a red flag? Treat any concerning trend as a prompt to contact your doctor promptly — the framework is a conversation-starter, not a treatment plan.
Is this safe for Type 1 diabetes? The self-tracking domains are generally applicable, but Type 1 diabetes management has specific medical requirements — always follow your endocrinologist’s guidance as the primary authority.
What are signs I should seek emergency care instead of tracking? Seek immediate medical care for symptoms such as very high or very low glucose readings with confusion or fainting, persistent vomiting, rapid breathing, fruity-smelling breath, or severe unexplained fatigue with confusion — these can indicate diabetic ketoacidosis or severe hypoglycemia and require emergency attention, not self-tracking.
References
Placeholder — to be finalized with verified, linkable sources before publishing. Do not publish with unverified citations.
- American Diabetes Association — Standards of Care in Diabetes (current edition)
- ADA Diabetes Spectrum / Diabetes Care — literature on Time in Range and glycemic variability as complements to HbA1c
- World Health Organization — Diabetes fact sheet
- International Diabetes Federation — Global guideline resources
Medical Review Block
Author/Reviewer: Dr. D.K. Rai, MBBS, MD, CDM Review date: 10-08-2026
Next review date: 10-08-2027
The Diabetes Transformation Score™ is an educational self-tracking framework developed by Diabetes Care Home™. It is not a diagnostic tool, is not endorsed by any medical guideline body, and does not replace HbA1c testing, physician visits, or prescribed treatment. Always consult your doctor before changing medication, diet, or exercise routines.
Final Call to Action
Primary: Take Your Free Diabetes Transformation Score™ — 5 minutes, instant dashboard
Secondary: WhatsApp 9773935777 / 9999434839 for guided program details
Tertiary: Join the 90-day program waitlist

