
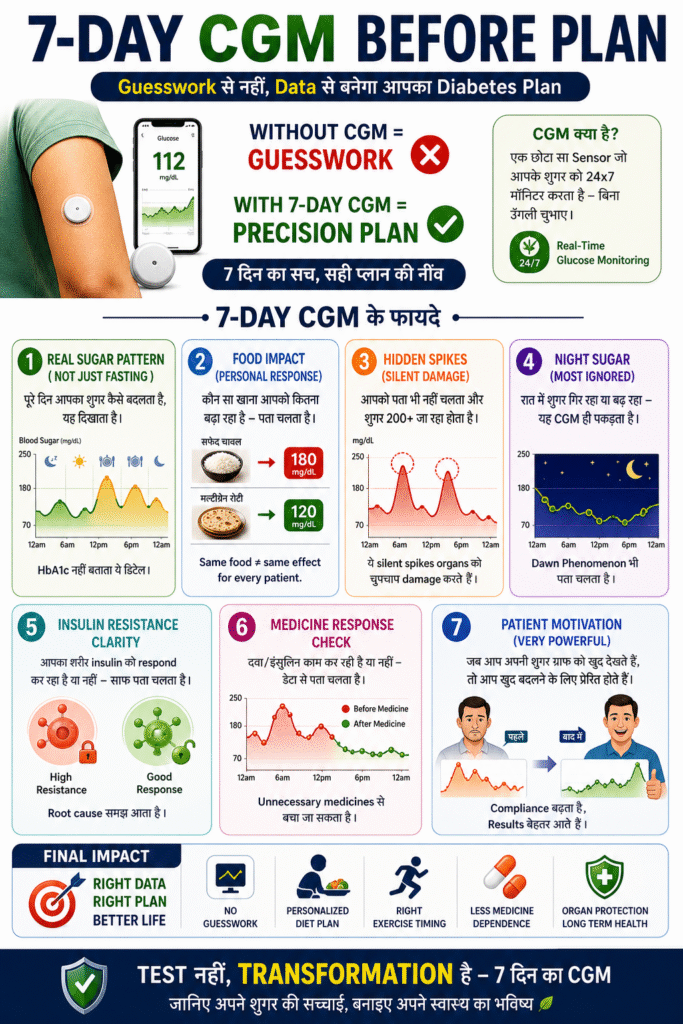
CGM Precision Intelligence™: How Continuous Glucose Monitoring Reveals Your Unique Patterns
Executive Summary
(5-minute read)
A fasting blood sugar reading is one sentence from a 400-page book. It tells you where you started the day — nothing about the three, four, or five chapters that followed: how your body responded to breakfast, to the stress of a difficult meeting, to an afternoon walk, to a late dinner, to a restless night.
Continuous Glucose Monitoring (CGM) reads the whole book. It shows not just a number, but a pattern — and patterns are what actually drive better conversations with your doctor and smarter day-to-day decisions.
This guide teaches you how to think about your own glucose patterns using CGM Precision Intelligence™, our educational framework for pattern-reading — without needing to become a data scientist, and without replacing your doctor’s clinical judgment.
Key Takeaways
- A single finger-prick reading captures a moment. CGM captures a story.
- HbA1c is an average — two people with an identical HbA1c can have very different, and differently risky, glucose patterns.
- CGM measures interstitial (tissue) glucose, not blood glucose directly — trends matter more than any single point.
- “Time in Range” is often more actionable day-to-day than HbA1c alone.
- Glucose variability — how much your sugar swings, not just how high it goes — is a meaningful pattern in its own right.
- The same meal can produce very different responses in different people.
- Sleep, stress, and activity show up on a CGM trace as clearly as food does.
- CGM is a discovery tool, not a diagnosis — it raises questions for your doctor, not answers that replace them.
- Prediabetes is where CGM patterns are often most eye-opening, since standard testing may still look “borderline normal.”
- The goal isn’t more data — it’s better questions.
Who Should Read This
Prediabetics curious about their personal risk · Type 2 diabetics whose numbers aren’t improving despite effort · Family members supporting someone with diabetes · Doctors & diabetes educators wanting a patient-friendly explainer · Hospital & corporate wellness programs exploring structured monitoring initiatives
What You’ll Learn
- Why fasting sugar, random sugar, and HbA1c each tell only part of the story
- How glucose monitoring has evolved — and what CGM adds that older methods can’t
- What CGM actually measures, in plain language
- How to read your own daily glucose curve using the 24-Hour Glucose Intelligence Dashboard™
- Sample patterns — breakfast spikes, overnight rises, stress and sleep effects — and what questions they raise
- How CGM connects to our broader Clinical Intelligence Frameworks™
- A realistic, non-guaranteed patient journey
- Your next step, if you want a personalised review
Table of Contents
- One Reading Tells One Chapter
- Why Finger-Prick Readings Tell Only Part of the Story
- The Evolution of Glucose Monitoring
- What CGM Actually Measures
- Introducing CGM Precision Intelligence™
- The 24-Hour Glucose Intelligence Dashboard™
- Sample Glucose Patterns — What They May Suggest
- Food, Movement, Sleep & Stress: What Shows Up on the Trace
- How CGM Connects to Our Clinical Intelligence Frameworks™
- A Dedicated Look: CGM and Prediabetes
- A Real Patient Journey
- CGM vs. Finger-Stick: A Fair Comparison
- 15 Questions People Ask Us Most
- Continue Your Diabetes Intelligence Journey
- A Note on Medical Safety
- One Reading Tells One Chapter
Every morning, Priya checks her fasting blood sugar. It reads 108 — slightly above ideal, but “not bad,” she tells herself. She feels reassured. Diabetes, she believes, is under control.
Then, for two weeks, she wears a CGM sensor for the first time. The fasting number on day one matches what her glucometer always showed. But the rest of the picture is new to her: a sharp spike to 220 after her regular breakfast of poha, a slower climb through a stressful 11 a.m. meeting, a steady overnight rise between 2 a.m. and 6 a.m. that her single morning reading never revealed.
What if one blood sugar reading tells only one chapter of the story — but not the whole book?
That question is the foundation of everything in this guide.
What You Should Do Today
If you’ve only ever checked fasting sugar, ask your doctor whether a short CGM trial (typically 10–14 days) makes sense for your situation — even a brief window can reveal patterns years of finger-pricks may have missed.
- Why Finger-Prick Readings Tell Only Part of the Story
| Test | What It Shows | Key Limitation |
| Fasting Sugar | Glucose level after ~8 hours without food | A single snapshot; misses everything that happens after you eat |
| Random Sugar | Glucose at one arbitrary moment | Highly dependent on timing; hard to interpret without context |
| HbA1c | Average glucose over ~2–3 months | Doesn’t show when spikes happen, how large they are, or how much your sugar swings day to day |
| CGM | Continuous trend, every few minutes, 24/7 | Requires a sensor and some learning; not a replacement for lab-confirmed diagnosis |
Myth Box
Myth: “If my HbA1c is fine, my glucose control must be fine.” Fact: Two people can share an identical HbA1c while one has smooth, stable readings and the other swings wildly between highs and lows all day. The average hides the pattern.
Doctor’s Note
None of these tests compete with each other — they answer different questions. HbA1c remains central for diagnosis and long-term tracking; CGM adds the day-to-day texture that HbA1c cannot show.
- The Evolution of Glucose Monitoring
| Era | Method | What Changed |
| Early 20th century | Urine sugar testing | Indirect, delayed, imprecise |
| 1970s–80s | Finger-stick glucometers | Direct, immediate, but a single point in time |
| 1990s | HbA1c testing | Long-term average — a major leap for tracking control |
| 2000s–2010s | Early CGM devices | Continuous trend data, initially bulky and clinical |
| Today | Consumer-friendly CGM (FreeStyle Libre, Dexcom, etc.) | Accessible, wearable, pattern-revealing |
| Emerging | Precision lifestyle medicine | Glucose patterns integrated with sleep, stress, activity, and habit data |
Each step didn’t replace the one before it — it added a layer of resolution. CGM is the highest-resolution layer available for day-to-day pattern recognition today.
- What CGM Actually Measures
A CGM sensor, usually worn on the arm, measures glucose in the fluid just under your skin (interstitial glucose) — not your blood directly. This fluid tracks blood glucose closely but with a short lag, typically a few minutes.
Key terms, simply explained:
- Trend arrow — shows whether your glucose is rising, falling, or stable, and how fast.
- Time in Range (TIR) — the percentage of the day your glucose stays within a target range set with your doctor.
- Glucose Variability — how much your readings swing up and down, independent of the average.
- Mean Glucose — your average reading over the monitoring period.
- Daily Profile — your typical 24-hour curve, once you overlay several days together.
Clinical Pearl
Time in Range is often more motivating day-to-day than HbA1c, because it updates in real time and reflects the choices you made today — not an abstract average from months of history.
- Introducing CGM Precision Intelligence™
CGM Precision Intelligence™ is our educational framework for turning a CGM trace into useful questions — not a diagnostic algorithm, and not a substitute for your doctor’s interpretation.
Purpose: To help you notice patterns, not just numbers.
How to observe patterns:
- Look at your curve across several days before drawing conclusions from any single day.
- Note what happened before a spike or dip — a meal, a walk, a stressful call, a poor night’s sleep.
- Compare similar days (two similar breakfasts, two similar stress levels) to see what’s consistent versus what’s situational.
- Separate the overnight/fasting portion of your curve from the daytime/meal-related portion — they often point to different drivers (see our companion guide, The 7 Hidden Drivers of High Blood Sugar).
Questions to ask yourself:
- Which meal produces my largest spike?
- Does my sugar stay high, or does it come back down within 2 hours?
- What does a “good” day look like for me, and what was different about it?
- Is my overnight trend flat, rising, or falling?
Questions to bring to your healthcare professional:
- “Here’s my typical daily pattern — what does this suggest to you?”
- “My mornings look different from my evenings — is that expected or worth investigating?”
- “Which of these patterns should I prioritise first?”
⚖️ Traditional Advice → Precision Diabetes
Generic Walking Advice → CGM-Informed Activity Timing Instead of “walk more,” CGM lets you see, specifically, that a 10-minute walk after your dinner flattens your curve — turning a general recommendation into a personal, evidence-based habit.
Rather than handing you an algorithm, this section teaches you how to read a day the way a clinician would — an observation framework, not a diagnostic system.
| Segment | What to Notice | Why It Matters |
| Overnight trend (11pm–6am) | Flat, rising, or falling? | A rising overnight trend may point toward liver-related or stress-hormone drivers |
| Morning rise (waking) | Sharp jump right after waking? | Often a normal hormonal effect (“dawn phenomenon”), but worth tracking over time |
| Breakfast response | Peak height and time to return to baseline | Reflects meal composition and sequencing |
| Mid-morning stability | Smooth or jagged? | Reflects how well the breakfast response resolved |
| Lunch response | Compare to breakfast — bigger, smaller, similar? | Helps identify your most “reactive” meal of the day |
| Afternoon activity window | Does movement flatten the curve? | Shows your personal exercise-response relationship |
| Dinner response | Timing and size relative to bedtime | Late, large dinners often show the slowest return to baseline |
| Evening trend | Descending smoothly, or spiking late? | Late spikes may reflect snacking, stress, or meal timing |
| Time in Range (full day) | % of day within your target range | A simple, trackable daily “grade” |
| Glucose variability (full day) | Smooth curve or sawtooth pattern? | High variability is worth flagging even if the average looks fine |
| Daily reflection | What’s one thing you’d try differently tomorrow? | Turns data into action, not just observation |
Common Mistake
Reacting to a single unusual day instead of looking for the pattern across a week. One spike could be a one-off; a repeated spike is a pattern worth discussing with your doctor.
Want a printable worksheet to fill this in daily, alongside a Meal, Walking, Sleep, and Stress log? It’s included in our Ultimate Diabetes Toolkit — see the end of this article.
- Sample Glucose Patterns — What They May Suggest
The following are educational, illustrative examples only. Individual glucose responses vary significantly, and any pattern should be discussed with your doctor rather than self-diagnosed.
| Pattern | Illustrative Description | Questions It May Raise |
| Breakfast spike | Sharp rise shortly after a carbohydrate-heavy breakfast, slow return to baseline | Would reordering the meal (protein/fibre first) help? |
| Lunch spike | Larger response at lunch than other meals | Is lunch portion or composition different from other meals? |
| Dinner spike with delayed return | High reading persisting late into the evening | Could timing or size of dinner be a factor? |
| Overnight rise | Gradual climb between 2–6 a.m. with no food involved | Worth discussing liver-related or hormonal factors with your doctor |
| Morning rise (“dawn phenomenon”) | Jump in the hour after waking, before any food | A common and often normal hormonal pattern — still worth tracking |
| Post-walk flattening | Curve levels off or dips after a walk | Illustrates your personal activity-response relationship |
| Stress-day elevation | Higher baseline on a demonstrably stressful day, similar food intake | Suggests a stress-hormone contribution worth tracking further |
| Poor-sleep-day elevation | Higher, less stable curve following a night of poor sleep | Suggests sleep quality as a contributing factor |
- Food, Movement, Sleep & Stress: What Shows Up on the Trace
Food Swap Intelligence™ — Illustrative Examples
| Traditional Meal | Alternative | Why It May Help |
| White rice, first on the plate | Same rice, eaten after vegetables/dal | May blunt the height and speed of the post-meal rise |
| Sweetened chai, 2–3 cups/day | Unsweetened or reduced-sugar chai | Fewer small, repeated spikes across the day |
| Heavy, late dinner | Earlier, lighter dinner | May support a smoother overnight trend |
| Fruit juice | Whole fruit | Fibre may slow the glucose rise |
Responses vary between individuals — this is why personal CGM observation is more useful than universal food rules.
Movement: A short walk after eating is one of the most consistently observed ways to flatten a post-meal curve on CGM traces — though the exact effect varies by person, meal, and walk duration.
Sleep: Nights with poor sleep quality are frequently followed by higher and less stable daytime curves the next day.
Stress: Demonstrably stressful days often show elevated baselines even when food intake is unchanged — a pattern many people are surprised to see in their own data for the first time.
- How CGM Connects to Our Clinical Intelligence Frameworks™
CGM data is most useful when it’s read alongside our broader system, rather than in isolation:
- REST Method™ — CGM helps you observe each pillar in action: Root causes show up as patterns, Eating strategy effects are visible meal-by-meal, Sleep and stress effects are visible overnight and on demanding days, and Tracking is exactly what a CGM trace provides.
- Root Cause Intelligence™ — glucose patterns often raise the right questions about meal timing, activity, sleep, stress, or medication — always for individualised assessment with your doctor, not self-diagnosis.
- Behaviour Intelligence™ — seeing your own curve respond to a walk or a better night’s sleep is one of the most powerful feedback loops for building lasting habits; awareness genuinely accelerates behaviour change.
- DORI™ (Diabetes Organ Risk Index) — glucose trends are one part of a much larger picture of long-term organ health; we explore this fully in The Hidden Organ Damage Diabetes Causes.
- Diabetes Transformation Score™ — CGM patterns feed into, but don’t replace, the broader monthly tracking approach covered in Why HbA1c Alone Cannot Measure Your Diabetes Progress.
- Diabetes Reversal Score™ — metabolic improvement exists on a spectrum, and no score or device guarantees reversal; CGM is one input among many in tracking that journey.
- A Dedicated Look: CGM and Prediabetes
Prediabetes is where CGM patterns are often most revealing — because standard tests may still read as “borderline normal” while daily patterns already show meaningful spikes.
Potential benefits some people report:
- Seeing a concrete, personal reason to change specific habits, rather than an abstract future risk
- Identifying which specific foods or situations affect them most
- Early motivation before a formal diabetes diagnosis
Limitations to keep in mind:
- CGM is not a diagnostic tool for prediabetes or diabetes — diagnosis relies on standard lab-confirmed testing
- Short-term CGM use is a snapshot of behaviour during that window, not necessarily a lifetime pattern
- Individual guidance from a doctor remains essential to interpret findings correctly
What You Should Do Today
If you’ve been told you’re “borderline” or prediabetic, ask your doctor whether a short CGM trial could help you see your personal patterns before they progress further.
- A Real Patient Journey
The following is a fictional, illustrative composite created for educational purposes. It does not represent a real patient, and outcomes are not guaranteed or typical — always consult your treating doctor.
“Priya” (composite, illustrative), 41, believed her diabetes was reasonably controlled based on a fasting reading that “looked fine most mornings.” A two-week CGM trial revealed a consistent, sharp spike after her usual breakfast and a slow overnight rise she had never suspected. Working with her doctor, she made two specific changes — reordering her breakfast and shifting dinner earlier — and repeated the CGM trial two months later. Her overall Time in Range improved, and her overnight trend flattened, alongside her unchanged medication.
This composite journey illustrates patterns seen in structured, doctor-supervised CGM use. No specific outcome, timeline, or level of improvement is guaranteed for any individual.
- CGM vs. Finger-Stick: A Fair Comparison
| Finger-Stick | CGM | |
| What it shows | A single point in time | A continuous trend |
| Frequency | As often as you test (typically 1–4x/day) | Every few minutes, 24/7 |
| Reveals meal response shape | No — only before/after snapshots | Yes — full curve, peak, and return to baseline |
| Reveals overnight pattern | No, unless tested specifically | Yes |
| Cost & accessibility | Lower cost, widely accessible | Higher cost, sensor-based, growing accessibility |
| Best for | Quick daily checks, medication dosing decisions (per doctor’s guidance) | Pattern discovery, habit feedback, understanding “why” |
Both have a role. Many patients benefit from using finger-stick testing for routine daily decisions and CGM periodically for deeper pattern discovery — as advised by their doctor.
- 15 Questions People Ask Us Most
- Is CGM only for type 1 diabetics? No — it’s increasingly used by type 2 diabetics and even some prediabetics to understand personal patterns.
- How long should I wear a CGM sensor to get useful data? Typically 10–14 days is enough to reveal meaningful patterns, though your doctor may suggest a different duration.
- Is CGM more accurate than finger-stick testing? They measure slightly different things (interstitial vs. blood glucose) with a short time lag; both are useful, and your doctor can advise when to prefer one over the other.
- Can CGM diagnose diabetes or prediabetes? No — diagnosis relies on standard lab-confirmed testing; CGM is a pattern-discovery tool used alongside diagnosis, not instead of it.
- Will my glucose pattern look exactly like the sample patterns in this article? No — these are illustrative only; your personal pattern is unique to you.
- Does everyone spike after the same foods? No — responses vary meaningfully between individuals, which is exactly why personal CGM observation is valuable.
- What is a “normal” Time in Range? Target ranges are individualised — discuss your personal target with your doctor.
- Can stress really show up on a CGM trace? Yes — many people observe elevated readings on demonstrably stressful days, even with unchanged food intake.
- Does a CGM sensor hurt to apply or wear? Most users describe application as a quick pinch; day-to-day wear is generally described as unobtrusive, though individual experience varies.
- Can I swim or exercise while wearing a CGM sensor? Most modern sensors are water-resistant; check your specific device’s guidance.
- What is the “dawn phenomenon”? A common, often normal rise in glucose in the early morning hours related to natural hormone changes — still worth tracking over time.
- Should I change my diet based on one day of CGM data? No — look for patterns across several days before drawing conclusions.
- Can CGM help me understand my exercise timing? Yes — many people use it to see which activity, and what timing, most effectively flattens their personal post-meal curve.
- Is CGM data alone enough to guide medication changes? No — medication decisions should always be made with your doctor, using CGM data as one input among several.
- Where can I get a personalised interpretation of my CGM data? See “Continue Your Diabetes Intelligence Journey” below.
- Continue Your Diabetes Intelligence Journey
Every person’s glucose pattern is unique — shaped by food, movement, sleep, stress, genetics, and more. A number on a screen is a starting point, not a conclusion.
If your own pattern raised questions while reading this, that’s exactly the point. Discuss it with your healthcare professional, or consider a personalised metabolic assessment — which may include CGM interpretation, lifestyle review, Root Cause Intelligence™, DORI™, and a personalised action plan.
Continue reading: Diabetes Is More Than a Sugar Problem · The 7 Hidden Drivers of High Blood Sugar · The 7 Organ Protection Framework™ · The Hidden Organ Damage Diabetes Causes (DORI™) · Why HbA1c Alone Cannot Measure Your Diabetes Progress, Doctor-Guided Diabetes Care with a Family Support System in India
- A Note on Medical Safety
This article is for educational purposes and does not constitute individual medical advice. CGM is a monitoring tool, not a diagnostic or treatment device, and does not replace laboratory-confirmed testing or your doctor’s clinical judgment. Never change any medication — including insulin dosing — based on CGM readings without your treating doctor’s explicit guidance. If you experience symptoms of low blood sugar (shakiness, sweating, confusion, rapid heartbeat), treat promptly per your doctor’s guidance and seek medical attention if severe.
© Diabetes Care Home™ | Make India Diabetes Free Mission. Educational content only — not a substitute for professional medical advice, diagnosis, or treatment. CGM Precision Intelligence™, the 24-Hour Glucose Intelligence Dashboard™, Food Swap Intelligence™, REST Method™, Root Cause Intelligence™, Behaviour Intelligence™, DORI™, Diabetes Transformation Score™, Diabetes Reversal Score™, and Diabetes Intelligence Letter™ are proprietary frameworks of Diabetes Care Home™.

